 Sign On
 By Michael Swanson, Ph.D., Chief Agricultural Economist, Wells Fargo Agri-Food Institute
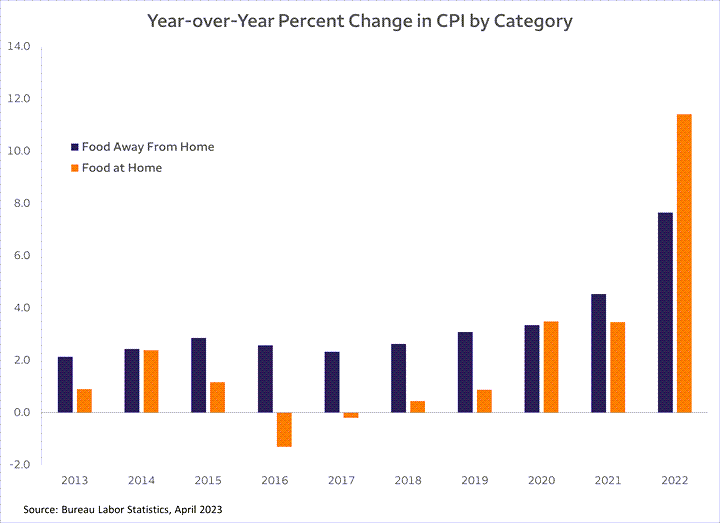
 U.S. consumers experienced the highest food inflation in decades starting with the COVID shock of 2020. In the 7 years prior to the COVID supply disruption, food-at-home inflation averaged 0.6% year over year, and the last 3 years has averaged 6.1%. This shock has largely passed through the system, and the outlook is for food inflation to return to its pre-COVID levels. This return to historical rates of inflation is expected to be largely complete in early 2024. Consumers will be happy, and the rest of the supply chain will be stressed. Food inflation was never about a lack of crops or livestock. Commodities markets are always volatile and sensitive to the smallest disruptions, but food is not about commodities.
According to the USDA’s food dollar series, only 12 cents out of every dollar goes to the farm level when food is purchased in the supermarket. And, the same series says that only one penny goes to the farm level when you eat away from home. On a blended basis, only about 6 cents of the food dollar lands at the farm and ranch gate. The recent burst of food inflation could not be about a lack of raw ingredients when so little of the food dollar goes to ingredients. Rather, it was about a lack of labor, trucks, pallets, and packaging. And really, the lack of trucks, pallets, and packaging was about a lack of labor.
The recovery of the labor markets has healed these supply disruptions, and the recent slowdown in wage growth reflects the reduced struggle to fill empty jobs. The month-to-month reports have lots of statistical noise in them, but transportation and warehouse services and nondurable manufacturing both show a slowing rate of increases.
I speak to many of our customers and prospects each month, and I always make sure to ask about their labor situation. Each company has unique issues based on geography and skill sets, but the rising and falling tide hits them all the same. The most recent JOLTS reports indicate that there are fewer job openings, and the quit rate has also slowed noticeably. The “quit rate” makes a big difference. Many companies have a number of high-turnover positions. Productivity in these positions gets hit hard when the turnover rate skyrockets.
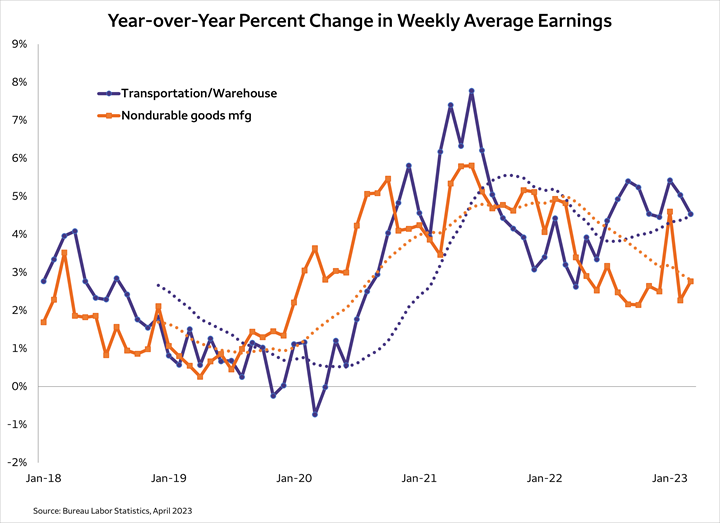
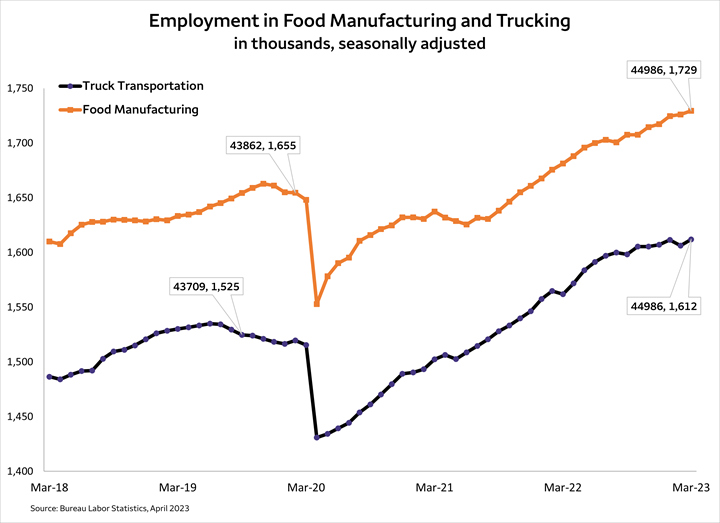
It appears that a top is forming in both the food manufacturing and truck transportation payroll numbers. Both segments jumped to big gains following the COVID disruption. Since February 2020, food manufacturing payrolls increased by 4.5% and nondurable manufacturing wages increased by 12.2% over the same period. Trucking saw even larger growth with payrolls up 6.1% and wages up by 13.5%. It is these wage increases that have been the driver of food inflation. Additionally, every time a food manufacturer increases their prices to the supermarkets, the supermarkets add markups to cover their own increased wage and overhead expenses.
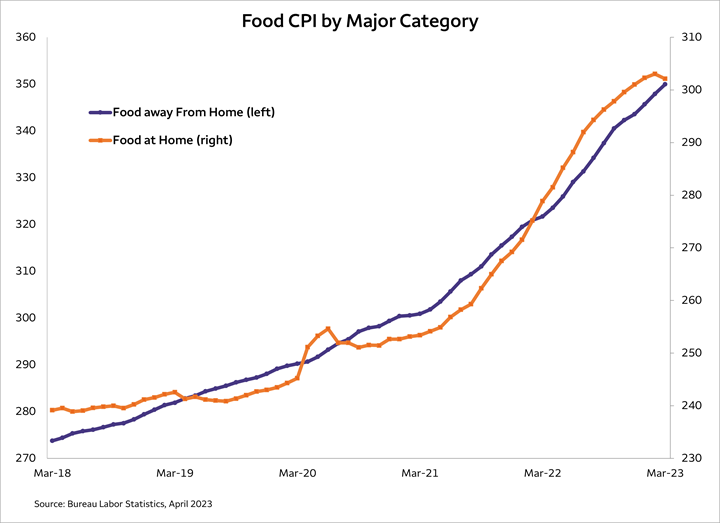
The normal pattern between food at home and away from home has started to reassert itself. Food service food inflation has been slower to increase than food at home which is not normal. The April CPI release showed the first month-on-month decline in food at home inflation since July of 2020 which followed the panic buying in early COVID. Even a sidewise movement on the index will be a dramatic slowdown throughout the rest of the year. But, the food away from home will continue to trend higher for much longer than the supermarket channel. This will pressure consumers to consider eating at home more often or altering which restaurants get their business.
There is nothing new in this consumer consideration, but it always creates winners and losers in the food manufacturing world. The underlying reality of value will be the biggest decision point for consumers as the slowdown in price increases allows them to find that value with greater clarity. So, it is back to creating convenience and flavors for the food industry which is the normal way business works within it.
 Michael Swanson, Ph.D. is the Chief Agricultural Economist within Wells Fargo's Agri-Food Institute. He is responsible for analyzing the impact of energy on agriculture and strategic analysis for key agricultural commodities and livestock sectors. His focus includes the systems analysis of consumer food demand and its linkage to agribusiness. Additionally, he helps develop credit and risk strategies for Wells Fargo’s customers, and performs macroeconomic and international analysis on agricultural production and agribusiness.
Michael joined Wells Fargo in 2000 as a senior economist. Prior, he worked for Land O’ Lakes and supervised a portion of the supply chain for dairy products, including scheduling the production, warehousing, and distribution of more than 400 million pounds of cheese annually, and also supervised sales forecasting. Before Land O’Lakes, Michael worked for Cargill’s Colombian subsidiary, Cargill Cafetera de Manizales S.A., with responsibility for grain imports and value-added sales to feed producers and flour millers. Michael started his career as a transportation analyst with Burlington Northern Railway.
Michael received undergraduate degrees in economics and business administration from the University of St. Thomas, and both his master’s and doctorate degrees in agricultural and applied economics from the University of Minnesota.
